
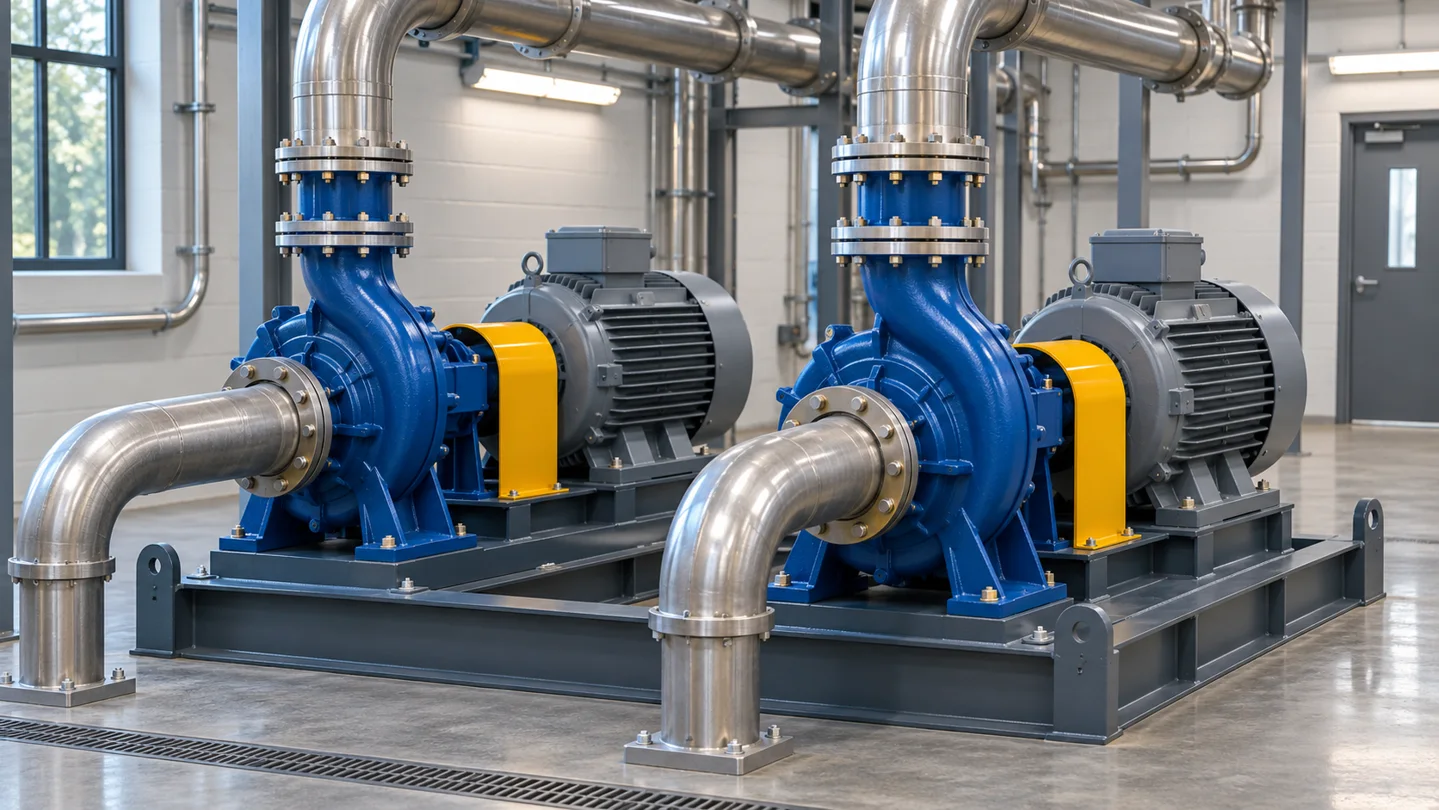
Parallel pump selection starts with the system curve. At a given head, add the flows from the pumps that can operate at that head. Then intersect the combined curve with the system curve to find the predicted operating point. The second pump usually increases total flow by less than the single-pump flow in a fixed system with rising friction losses.
A worked comparison
Consider two identical pumps with a simplified head curve H = 50 − 0.002Q², where H is in metres and Q is in m³/h. Assume a fixed system curve H = 20 + 0.001Q². With one pump, equating the curves gives 100 m³/h at 30 m head. With two equal pumps, each supplies half the total flow, giving H = 50 − 0.0005Q² for the combined curve. The two-pump operating point is about 141 m³/h total at 40 m head, or about 71 m³/h per pump. These are illustrative curves and omit individual branch losses.
What to compare before selecting a configuration
- Model one pump, both pumps, and any required standby condition at the applicable liquid levels and valve positions.
- Check per-pump flow, absorbed power, the permitted operating range and suction margin for each case.
- For dissimilar pumps, review shutoff heads and branch losses with the manufacturers to see whether each pump can contribute at the common operating head.
- Record the hours spent at each load and compare energy across the duty profile using pump, motor and drive efficiencies where applicable.
The U.S. Department of Energy guide to parallel pumping shows how a composite curve shifts the operating point. The Bureau of Energy Efficiency’s pumping systems guide covers pump staging and operating range considerations.
What to bring to a software demo
Prepare the manufacturer curves, your system head model, the liquid properties and the operating schedule. Ask the vendor to show per-pump and total flow side by side, identify the assumptions, and export a record your team can review. Start with Velotech’s pump curve comparison guide and pump selection software demo checklist.

Pingback: Variable Speed Pump Energy Savings | Calculation Guide