
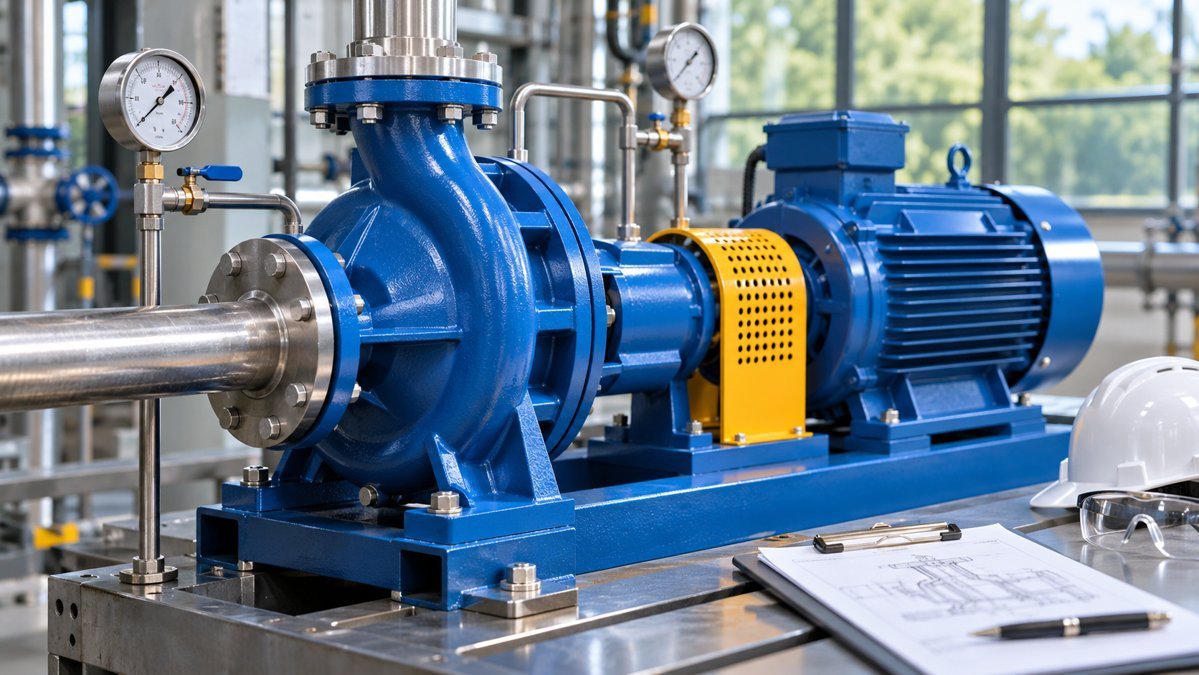
To read a centrifugal pump curve, find the required flow on the horizontal axis and the required head on the vertical axis. Compare that duty point with the manufacturer’s head–flow curve for the quoted speed and impeller diameter. Then check efficiency, shaft power, and suction requirements at the expected operating point.
What the pump performance curve shows
- Flow and head: U.S. pump curves commonly use gallons per minute (GPM) and feet of head. Head represents energy per unit weight of liquid. The equivalent pressure difference depends on liquid density.
- Efficiency: The best efficiency point (BEP) is the flow and head where pump efficiency peaks for that speed and impeller diameter. Compare normal operation with the manufacturer’s preferred operating region.
- Shaft power: Read brake horsepower at the duty point and check the expected power over the planned operating range before confirming the driver.
- Suction requirement: Compare the chart’s NPSH value with the system’s NPSH available and the margin appropriate for the service.
For annotated examples of these curves, see the Hydraulic Institute pump curve guide.
Example: 400 GPM at 90 feet of head
Suppose a water system needs 400 GPM at 90 feet of total dynamic head. A candidate curve shows about 90 feet at 400 GPM, the BEP is 430 GPM, and the efficiency at duty is 75%. These illustrative values suggest the pump is worth a closer look. Check the full operating range against the manufacturer’s limits before selecting it.
For water with specific gravity near 1.0, a quick shaft-power estimate is (400 × 90) ÷ (3,960 × 0.75) ≈ 12.1 hp. That is an estimate at the stated duty. Compare the manufacturer’s power curve across all expected conditions before sizing the motor.
How to find the actual operating point
The pump curve describes what the pump can deliver. The system curve describes the head the piping system requires at each flow. Their intersection estimates where the pump will operate. Check the intersection again if tank levels, valve positions, or pump speed change. See the Hydraulic Institute’s pump and system curve examples.
What to verify on a supplier quotation
Ask for the exact speed and impeller diameter, the liquid properties used for the curve, and the preferred operating range. For projects comparing vendor options, see Velotech’s pump selection software comparison guide and ISO 9906 pump test report checklist.